Having prepared the comic descriptions for analysis, we can count the characters’ appearances and calculate their prominences. Here is the code. As a quick summary, here are the comments from the main function of that code:
'''
Searches for words or phrases (mostly character names) in text descriptions
    of Peanuts and marks whether each word or phrase appears in each
    text description
Adjusts counts in several ways:
    1) combines word/phrases that refer to the same character (e.g.,
        'Pig-Pen' and 'Pig Pen')
    2) corrects counts to distinguish between Patty and Peppermint Patty
    3) removes any appearances that occur before a character's first
        appearance in the comic strip or after the character's last
        appearance
    4) corrects for some cases where characters are misidentified by the
        text description of the comic (based only on happenstance
        observations, not on a systematic or comprehensive search for such
        misidentifications)
    5) provides combined count data for Snoopy and many of his personas, in
        case Snoopy is sometimes referred to by only a persona in a text
        description of a comic
Provides count data for each panel (Boolean:  whether the word/phrase
    appears or not) in a comic and for each comic (sum of appearances for
    panels of that comic); also provides per-comic data as proportions
    (i.e., in what proportion of panels did the word/phrase appear for that
    comic?)
Also provides summary tables of per-panel and per-comic count data
'''
Next, we want to plot those prominences. Here is the code. Notice that we’ve switched from Python to R and ‘ggplot2’.
I’ll highlight one thing from the code: we used a dynamic rolling average so that we didn’t have to exclude any comic strips from our plot. Here’s the explanation from the code’s comments:
 # Problem:  Calculating rolling averages across a series of data points
 #    requires trimming the data points at the end so that they are not used
 #    in the calculations
 # Rolling averages are calculated across a moving window of consecutive
 #    data points.  The position of the data point of interest is always in
 #    the middle of the window.
 # Solution:  When the data point of interest is at the start/end/edge of
 #    the data series, allow it to be at the edge of the window.  As the
 #    calculation of the average rolls/advances through the data series,
 #    gradually move the data point's position from the edge to the middle
 #    of the window.
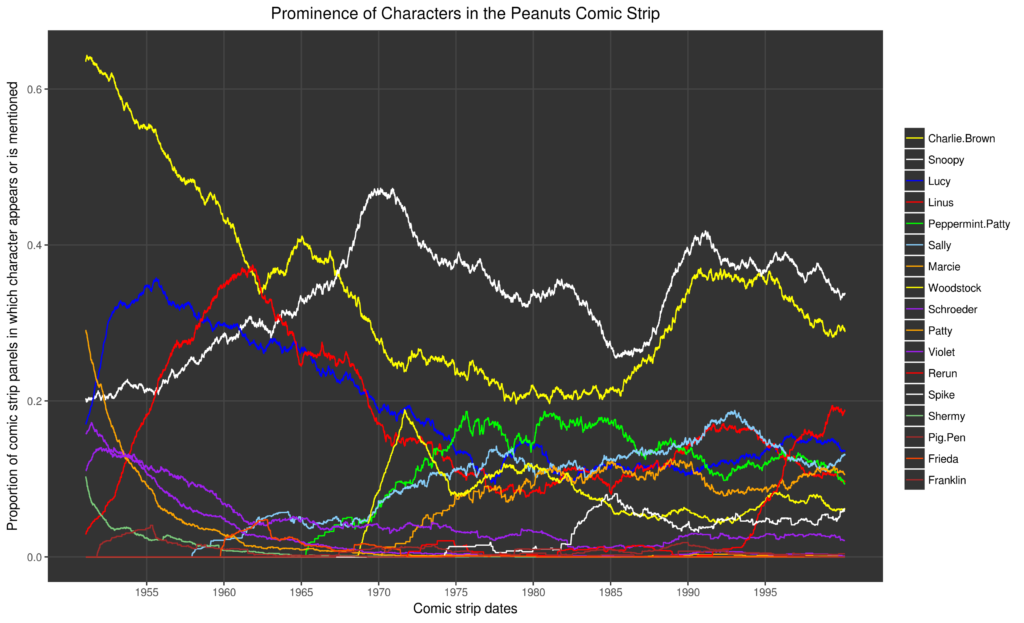
Finally, here is the resulting plot: