The code in this repository runs a Plotly Dash app that displays profit/loss and other metrics to track performance per transaction or over time. The app also allows filtering of transactions by financial instrument type (i.e., stocks or options), long or short positions, bullish or bearish positions, transaction dates, instrument price, number of shares/contracts, custom user-provided tags, and other variables.
A video showing some of the app’s features using fake example data is below.
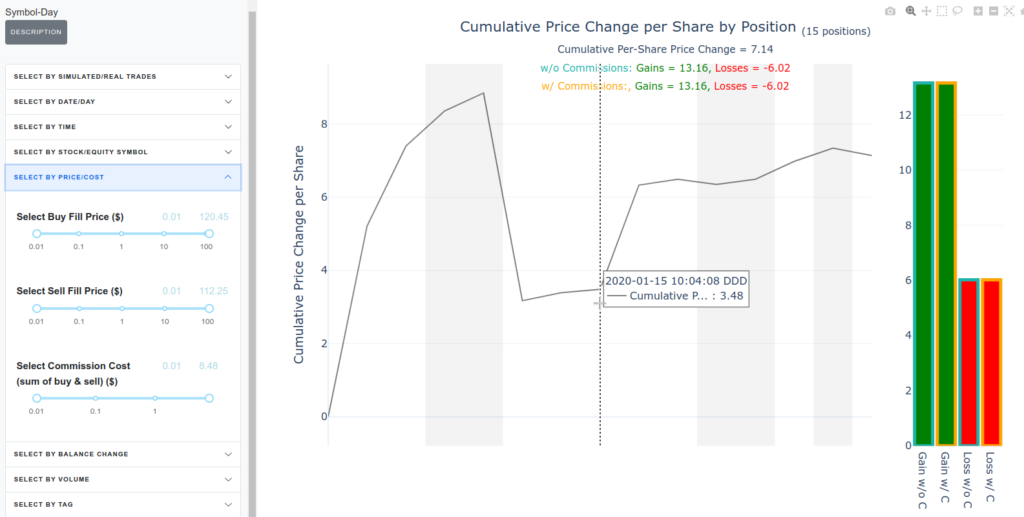
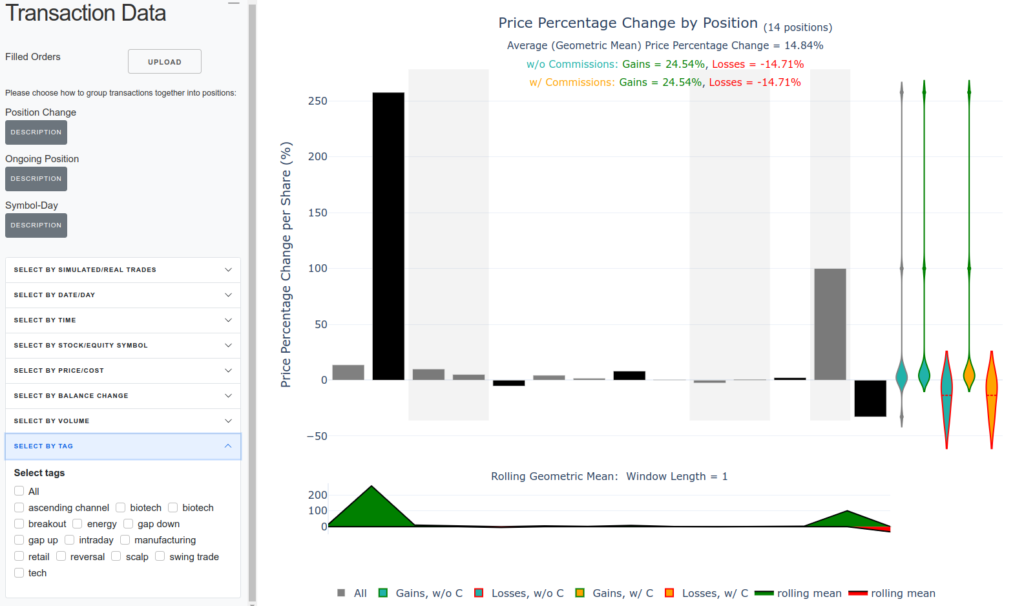
Some screenshots from the app using fake example data are below.